
/cloudfront-us-east-1.images.arcpublishing.com/morningstar/DFL7ZZS5WRGEFNHTIY2MEQVXGA.png "Don’t Let Bad Timing Decrease Your Fund Returns")
We recently published our annual Mind the Gap research on investor returns. Below is an excerpt from Jeff Ptak’s report. I followed this up (starting with The Best and Worst Investor Return Gaps) by looking at funds with the biggest and smallest investor return gaps to illustrate some of the principles.
Imagine you invest in a fund. Over the next 10 years, it generates a 7.3% total return per year after fees. Not bad. But when you check your brokerage statement and do the math, you find you earned about 1.1 percentage points per year less than that. What gives?
A fund’s total return assumes an initial lump-sum purchase that’s held until the end. But that’s not how you invested. You made an initial purchase, added to it, withdrew a chunk, sold a bit more, and then made a final buy. Thus, your return won’t be the same as the buy-and-hold return. It’ll be whatever your average dollar earned, given the timing and amount of those buys and sells. If you buy high and sell low, your return will lag the buy-and-hold return. That’s why your return fell short.
Mind the Gap
We’ve been studying this phenomenon—which we call the “investor return gap”—for nearly two decades. We published our latest installment of the research, finding that investors lost out on around 15% of the returns their fund investments generated over the 10 years ended Dec. 31, 2023, as explained further below.
Here are the key takeaways from this year’s Mind the Gap study (gap numbers may not match differences in returns because of rounding):
• Fund investors earned a 6.3% dollar-weighted return (investor return) per year over the 10 years ended Dec. 31, 2023, while their fund holdings earned about 7.3% per year (total return).
• The 1.1-percentage-point annual estimated return gap—equivalent to around 15% of funds’ aggregate average total return—was broadly in line with the gaps measured over the rolling 10-year periods ended in December 2019, 2020, 2021, and 2022.
• The average dollar’s return lagged the average total return in all 10 of the calendar years in the study period; investors appear to have incurred heavy timing costs in 2020 (leading to a gap of negative 2.0 percentage points that year).
• Allocation funds had the narrowest gap (negative 0.4 percentage points per year over the 10 years ended Dec. 31, 2023, which was less than half the gap for funds as a whole). This means allocation fund investors kept significantly more of their returns than investors did in other category groups.
• This continues a consistent pattern in which investors in all-in-one, multi-asset strategies have captured the largest portion of their funds’ total returns; conversely, sector equity funds had the widest gap (lagging by 2.6 percentage points annually), which echoed our findings in previous studies.
• Open-end funds earned a 6.1% investor return per year (a gap of negative 1.0 percentage points) versus 6.9% for exchange-traded funds (a gap of negative 1.1 percentage points); gaps were generally narrower for open-end funds than ETFs even when we controlled for asset class.
• The average dollar invested in index funds earned a 7.6% annual return (negative 0.8-percentage-point gap) compared with 5.5% per year in active funds (negative 1.2-percentage-point gap).
• While there was a small gap for index mutual funds over the 10-year period (negative 0.2 percentage points per year), that wasn’t true of index ETFs, where the average dollar earned 1.1 percentage points less per year than the buy-and-hold return.
• The more volatile a fund’s returns versus peers, the larger the gaps tended to be; the average dollar invested in the most volatile sector equity funds lagged the buy-and-hold return by over 7 percentage points per year.
• Encouragingly, investors earned high dollar-weighted returns in popular fund types like US equity (10% investor return per year) and allocation (5.9% annually); on the flip side, alternative funds were the only fund type that failed to generate a positive investor return over the study period.
Our annual Mind the Gap study found that investors captured a large chunk of their funds’ total return over the 10 years ended Dec. 31, 2023, but not all of it. The 1.1-percentage-point annual gap is significant, amounting to around 15% of the total return that funds generated in aggregate over this span. Investors could capture more of their funds’ total returns by holding the line on transactions, perhaps by opting for widely diversified all-in-one options like allocation funds that automate certain tasks while avoiding narrower, volatile strategies that are harder to handle.
The Best and Worst Investor Return Gaps
Let’s drill down to see some examples of the best and worst investor return gaps. I looked at 10-year results because it’s really a long-term story about how good and bad timing can have a big impact over time.
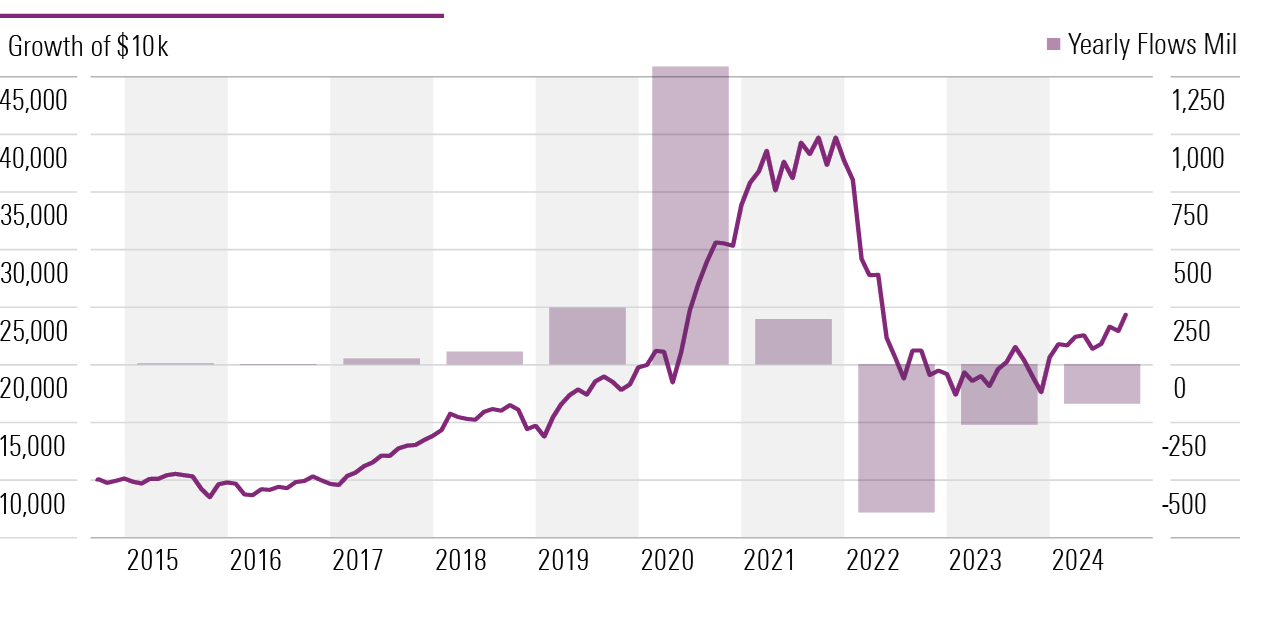
With a five-year standard deviation of 37, Morgan Stanley Institutional Discovery MACGX is by far the most volatile fund in the Morningstar FundInvestor 500. Not surprisingly, it also had the largest returns gap. The fund had a 10-year return of 7.8%, but the average investor lost 3.4% annualized, producing an 11.2-percentage-point gap. In 2020, the fund logged a 142% gain, and in 2022, it lost 64%. Huge gains like in 2020 are a sign to trim or sell entirely. At the very least, don’t jump in after a triple-digit gain.
Baron Global Advantage BGAFX produced a 9.0% return, but investors only gained 1.7% annualized. This aggressive fund ranks seventh in standard deviation. After a 45% gain in 2019 and a 79% gain in 2020, the fund suffered a 52% loss in 2022 as aggressive growth names corrected sharply. The fund ended 2019 with $400 million in assets but then saw $1.3 billion come in the next year just before the sharp loss. The fund then shed more than $1.0 billion from 2022 to the present. In short, most investors captured very little of the rally but all of the selloff.
Next up is WCM Focused Emerging Markets WFEMX, which has a Morningstar Medalist Rating of Bronze. It returned 3.5%, but investors lost 3.5% annualized. Once again, a big rally led to late investors buying near the top.
I mentioned that you shouldn’t buy after a massive gain. Another strategy for managing extreme funds like these is to keep your positions to 5% or less. Extreme returns with modest dollar values are less likely to cause you to sell at the bottom or double down at the top. Small position sizes will also reduce the damage you can do to yourself.
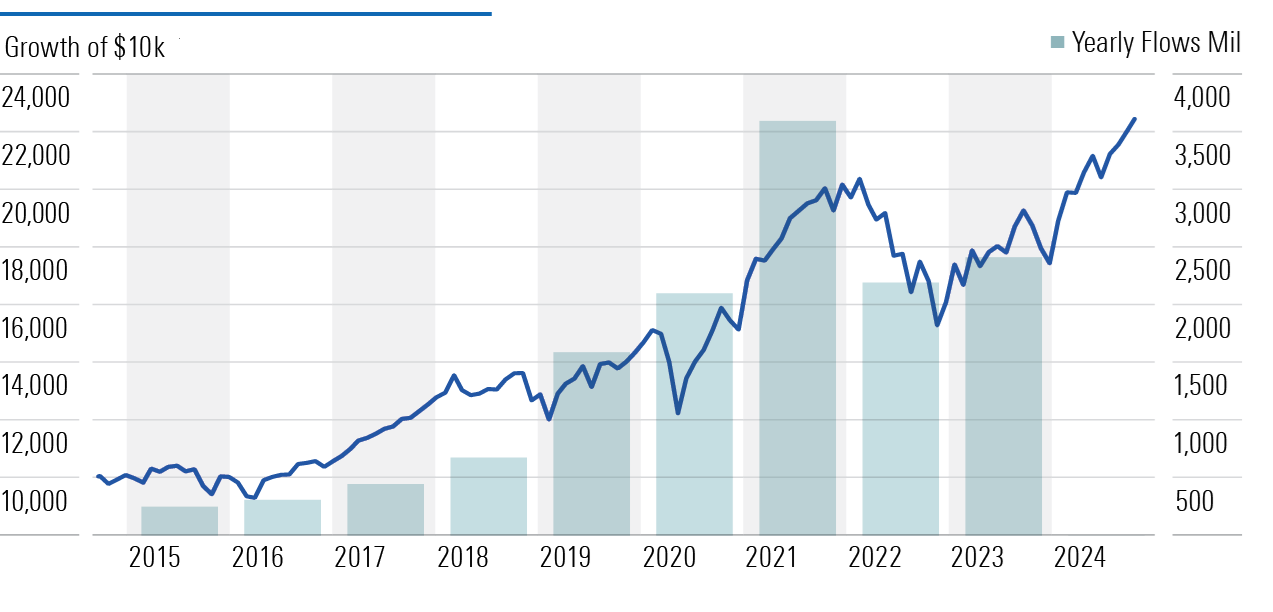
Let’s skip on to the fund with the 19th biggest gap. PGIM Jennison Global Opportunities PRJAX had a 3.35-percentage-point gap, but investors still enjoyed an outstanding 10.5% annualized return. If you pick a good fund and can hold on, then it’s a win. Investors did well here even with flawed timing. The fund gained 74% in 2020 and lost 40% in 2022. However, it rebounded nicely with a 41% gain in 2023 and a 23% year-to-date gain in 2024. The fund had $9.0 billion at the end of 2021 and had outflows of $1.4 billion in 2022 because of the big loss. That’s not as big on a percentage basis as the other funds, but its swift rebound in 2023 quickly stemmed the tide of outflows and rewarded those who stayed.
A number of Morningstar 500 funds had positive return gaps, meaning investors earned better returns than the official returns. The funds at the top of the list tended to be less volatile than the funds mentioned above but were still more volatile than peers.
Two of the top three slots went to LSV funds, LSV Value Equity LVAEX and LSV Small Cap Value LVAQX. The firm runs quantitative deep-value strategies. Deep value hasn’t had huge gains in a very long time, so you certainly didn’t get the sort of returns that draw the hot fund chasers. Still, deep-value funds have had some rough years of late, so I wouldn’t have guessed these funds would do so well. But a closer look at LSV Value Equity’s returns shows that the fund’s 14.8% loss in 2018 was sandwiched between two good years before it and one good year after. That was probably sufficient to keep investors on board. The fund gained about 17% in those first two years, then lost 14.8% but rebounded for a 25% gain the next year. The fund had its biggest inflow in 2018, so the timing wasn’t perfect, but generally flows were pretty muted. Overall, the fund’s official returns were a little below average, but investor returns were top 10%.
Brown Capital Management Small Company BCSIX landed in the second spot, and its success is less surprising. Although the fund is relatively volatile, the firm regularly closes it to new investors to preserve its style, which could be undermined by big flows. Thus, investors were protected from themselves because they couldn’t open an account in the fund after many of its best years. However, the fund’s current slump has spurred sizable outflows, and that may mean its investor return story will be worse in the coming years.
What About Best and Worst Investor Returns?
For a different perspective, let’s look at the highest and lowest investor returns. The gaps tell us a story about good and bad timing. The absolute return figures tell us where investors made or lost the most.
Over the past 10 years, the top 19 investor returns in the Morningstar 500 were all either tech or large-growth funds. It just shows how important it is to stay diversified and stick with it. Fidelity Select Technology FSPTX produced a 20.3% annualized return and a 19.2% investor return. So, its 1.1-percentage-point gap was pretty typical, but with such huge returns, who cares? Next on the list was Fidelity Growth Company FDGRX, Janus Henderson Global Technology and Innovation JAGTX, MFS Technology MTCAX, and Fidelity OTC FOCPX. In short, technological innovation has reshaped our economy and rewarded investors handsomely.
At the bottom was the aforementioned WCM Focused Emerging Markets with a 3.5% return and a 3.5% loss. It was volatile and had low returns. Morgan Stanley Institutional Discovery had decent 7.8% returns but negative 3.4% investor returns. Templeton Global Bond TPINX had a dismal 1.6% loss and a negative 2.0% investor return. If the fund loses money, good timing won’t help very much.
Another consistent area of poor investor returns has been alternatives. Returns have been quite low, but investors’ poor timing suggests they don’t fully understand what they own. They often get out when the funds lose money because they thought the funds were more defensive than they were.
Conclusion
It’s much easier to stick around for the good times when the bad times are not so rough. Look at your portfolio to see what your long-term winners look like and how well you handled sell decisions. If your selling mistakes were mostly high-risk funds, you might want to screen out funds that have High Morningstar Risk ratings or high absolute standard deviation figures.
This article first appeared in the September 2024 issue of Morningstar FundInvestor. Download a complimentary copy of FundInvestor by visiting this website.
link


